Corrected Bond Stretch
[65]:
import numpy as np
import matplotlib.pyplot as plt

import matplotlib as mpl
mpl.rcParams["font.size"] = 10
mpl.rcParams["font.family"] = "sans-serif"
mpl.rcParams["axes.edgecolor"] = "#eae8e9"
H2PLUS
[84]:
h2plus_distance = np.load('./h2plus_distance.npy')
h2plus_lda = np.load('./h2plus_lda.npy')
h2plus_overlap = np.load('./h2plus_overlap.npy')
h_energy = -0.23839575845846386
# Figure
fig, ax = plt.subplots(1,1, dpi=100)
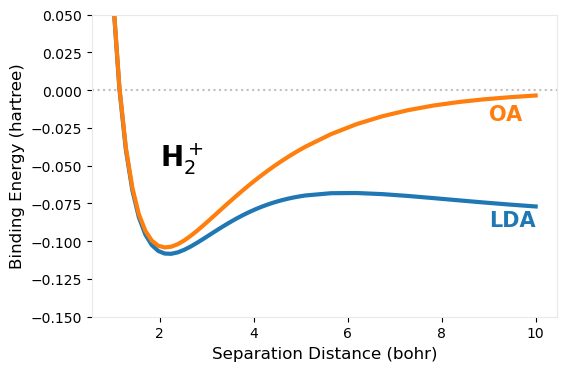
ax.axhline(y=0, alpha=0.5, c="grey", ls=":")
ax.plot(h2plus_distance, h2plus_lda - 2*h_energy , lw=3)
ax.plot(h2plus_distance, h2plus_overlap - 2*h_energy, lw=3)
# Text inside plot
# "H$_2^+$", fontsize=15, fontweight="bold"
ax.text(2,-0.05, "H$_2^+$", color="black", fontsize=20, fontweight="semibold")
ax.text(9,-0.02, "OA", color="tab:orange", fontsize=15, fontweight="semibold")
ax.text(9,-0.09, "LDA", color="tab:blue", fontsize=15, fontweight="semibold")
ax.set_ylim(-0.15,0.05)
ax.set_xlabel("Separation Distance (bohr)", fontsize=12)
ax.set_ylabel("Binding Energy (hartree)", fontsize=12)
# ax.legend()
[84]:
Text(0, 0.5, 'Binding Energy (hartree)')
H2
[83]:
h2_distance = np.load('./h2_distance.npy')
h2_lda = np.load('./h2_lda.npy')
h2_overlap = np.load('./h2_overlap.npy')
h_energy = -0.47790086199331666
fig, ax = plt.subplots(1,1, dpi=100)
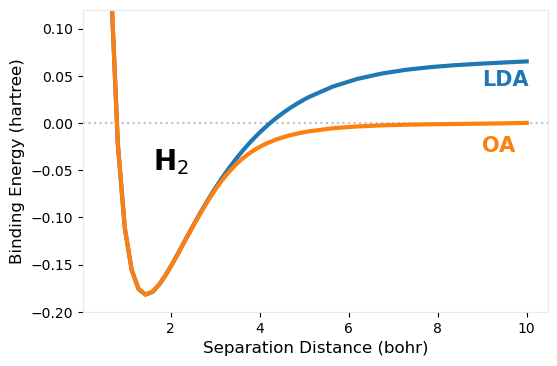
ax.axhline(y=0, alpha=0.5, c="grey", ls=":")
ax.plot(h2_distance, h2_lda - 2*h_energy, lw=3)
ax.plot(h2_distance, h2_overlap - 2*h_energy, lw=3)
ax.text(1.6,-0.05, "H$_2$", color="black", fontsize=20, fontweight="semibold")
ax.text(9,-0.03, "OA", color="tab:orange", fontsize=15, fontweight="semibold")
ax.text(9, 0.04, "LDA", color="tab:blue", fontsize=15, fontweight="semibold")
ax.set_ylim(-0.15,0.05)
ax.set_xlabel("Separation Distance (bohr)", fontsize=12)
ax.set_ylabel("Binding Energy (hartree)", fontsize=12)
ax.set_ylim(-0.2,0.12)
[83]:
(-0.2, 0.12)
[ ]: