Stretched LDA H_2
[1]:
import numpy as np
from CADMium import Psgrid
from CADMium import Kohnsham
import matplotlib.pyplot as plt
[2]:
dis_eq      = np.linspace(0.5,5,30)
dis_st      = np.linspace(5.1,10,10)
distances   = np.concatenate((dis_eq, dis_st))
lda_energy  = []

Za, Zb = 1,1
Nmo = [[1,1]]
N   = [[1,1]]
pol = 2
NP, NM = 7, [4,4]
optKS = {"xc_family"  : "lda",
         "xfunc_id"   : 1,
         "cfunc_id"   : 12,
         "sym"        : True,
         "fractional" : False}


for d in distances:
    #Initialize Grid and Separation
    a =  d/2
    L = np.arccosh(10./a)
    loc = np.array(range(-4,5))
    grid = Psgrid(NP, NM, a, L, loc)
    grid.initialize()

    #Kohn Sham Object. SCF Calcualtion
    KS = Kohnsham(grid, Za, Zb, pol, Nmo, N, optKS)
    KS.scf({"disp" : False})
    lda_energy.append(KS.E.E)
    print(f" Distance: {d} -> Energy: {KS.E.E}")

# Store results
energy    = np.array(lda_energy)
np.save('h2_distance.npy', distances)
np.save('h2_lda.npy', lda_energy)
 Distance: 0.5 -> Energy: -0.4684324535052049
 Distance: 0.6551724137931034 -> Energy: -0.8083407156250979
 Distance: 0.8103448275862069 -> Energy: -0.97842718732902
 Distance: 0.9655172413793104 -> Energy: -1.0667404443615993
 Distance: 1.1206896551724137 -> Energy: -1.1115704089542473
 Distance: 1.2758620689655173 -> Energy: -1.1318202580552466
 Distance: 1.4310344827586208 -> Energy: -1.1376537973331131
 Distance: 1.5862068965517242 -> Energy: -1.1348780722421599
 Distance: 1.7413793103448276 -> Energy: -1.1269625395137237
 Distance: 1.896551724137931 -> Energy: -1.1160498352041444
 Distance: 2.0517241379310347 -> Energy: -1.1034954497077645
 Distance: 2.206896551724138 -> Energy: -1.090171017251243
 Distance: 2.3620689655172415 -> Energy: -1.0766420207752279
 Distance: 2.5172413793103448 -> Energy: -1.0632755819428226
 Distance: 2.6724137931034484 -> Energy: -1.0503077720307186
 Distance: 2.8275862068965516 -> Energy: -1.0378867213699405
 Distance: 2.9827586206896552 -> Energy: -1.0261008151622297
 Distance: 3.137931034482759 -> Energy: -1.0149974994056163
 Distance: 3.293103448275862 -> Energy: -1.0045960328984411
 Distance: 3.4482758620689657 -> Energy: -0.9948962656705309
 Distance: 3.603448275862069 -> Energy: -0.9858852452776176
 Distance: 3.7586206896551726 -> Energy: -0.9775397773469396
 Distance: 3.913793103448276 -> Energy: -0.9698318987930303
 Distance: 4.068965517241379 -> Energy: -0.9627296740026599
 Distance: 4.224137931034483 -> Energy: -0.9561991097679967
 Distance: 4.379310344827586 -> Energy: -0.950205315730581
 Distance: 4.5344827586206895 -> Energy: -0.9447133436002727
 Distance: 4.689655172413794 -> Energy: -0.9396887898775765
 Distance: 4.844827586206897 -> Energy: -0.9350982226710518
 Distance: 5.0 -> Energy: -0.9309094765957149
 Distance: 5.1 -> Energy: -0.9284085724229765
 Distance: 5.644444444444444 -> Energy: -0.917165411761904
 Distance: 6.188888888888888 -> Energy: -0.9091554695880649
 Distance: 6.733333333333333 -> Energy: -0.9034940552888145
 Distance: 7.277777777777778 -> Energy: -0.8995056933150725
 Distance: 7.822222222222222 -> Energy: -0.8966827070085016
 Distance: 8.366666666666667 -> Energy: -0.8946401351598964
 Distance: 8.911111111111111 -> Energy: -0.8930881023753587
 Distance: 9.455555555555556 -> Energy: -0.8917960645167057
 Distance: 10.0 -> Energy: -0.890566987826421
[3]:
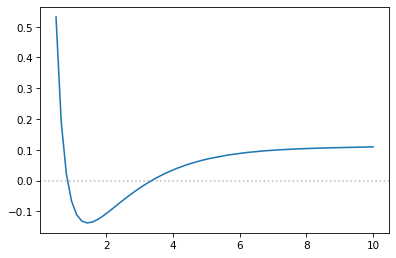
h_energy  = -0.5
energy    = np.array(lda_energy)

fig, ax = plt.subplots(1,1, dpi=75)

ax.axhline(y=0, alpha=0.5, c="grey", ls=":")
ax.plot(distances, energy - 2*h_energy)
# ax.set_ylim(-1.2,-0.1)
[3]:
[<matplotlib.lines.Line2D at 0x7fcc42a164c0>]
[ ]: